As noted earlier, hearing loss is often unreported or underreported due to “denial” or nonacceptance of hearing loss. This poses a potential problem with all estimates of hearing loss. At this time, there is not a single agreed-upon methodology for estimating hearing loss in the U.S. Therefore, states and other interested groups must determine the approach, within available resources, to estimating hearing loss that best meets their needs.
Estimates of hearing loss are available from two government agencies and other organizations. Both the U.S. Census Bureau through the American Community Survey (ACS) and the Centers for Disease Control (CDC) through the National Health Interview Survey (NHIS) measure hearing loss in separate surveys on an annual basis. The CDC also captures data in two-year cycles on hearing loss through the National Health and Nutrition Examination Survey (NHANES). In addition, other organizations and studies periodically estimate hearing loss in the U.S. For example, Johns Hopkins University has published a number of studies regarding the estimated number of individuals with hearing loss and risk factors associated with hearing loss. Gallaudet University also publishes data on deafness and hearing loss on its website.
The U.S. Census Bureau is charged with measuring disability status for the purpose of determining federal funding for various programs. Through its American Community Survey, the Census Bureau asks a single question about hearing loss. Estimates are produced by state and the nation for all age groups.
The CDC, on the other hand, is responsible for measuring the health status of Americans. The CDC’s NHIS is conducted through face-to-face interviews and contains several questions aimed at determining hearing loss. The NHIS is used to estimate the prevalence of hearing loss for non-institutionalized adults in the U.S. (see CDC/National Center for Health Statistics, NHIS Series 10 Reports). The NHIS estimates are not reported by state. The NHANES is designed to assess the health and nutritional status of children and adults through interview and medical examination data. This data is used by researchers to assess medical conditions and health indicators. Publically available compiled reports from the NHANES do not provide hearing loss estimates for all adults by age group.
In 2011, Johns Hopkins University published several journal articles on hearing loss, including estimates of those ages 50 and older with hearing loss. Using detailed NHANES data sets from 2001 through 2008, researchers at Johns Hopkins analyzed multi-year data and estimated that 20.3% of all Americans, age 12 and older, have a hearing loss.
The most recent data on hearing loss by state on Gallaudet University’s website uses the 2008 ACS data as its source of estimates of hearing loss and deafness.
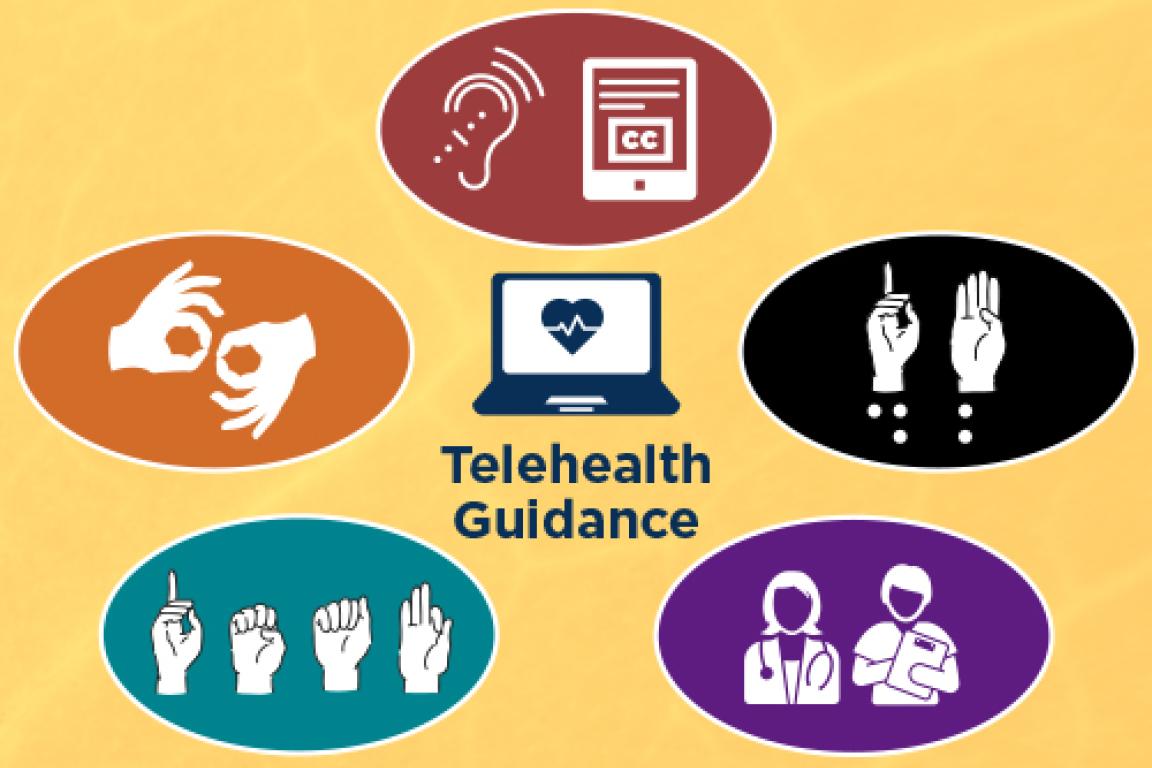
The Division of Services for the Deaf and the Hard of Hearing’s (DSDHH) selected the NHIS national estimates of hearing loss by age as the proxy for projecting hearing loss among adults in North Carolina. The primary reasons for this selection are:
The State Data Center of the N.C. Office of State Budget and Management (OSBM) is a member of the Federal State Cooperative Program for Population Estimates (FSCPPE). In that role, the State Data Center works closely with the U.S. Census Bureau to provide routine updates on North Carolina state and county population projections between the decennial censuses. These projections by age and county are used for long range planning purposes in N.C. government. Thus, these population projections were used in developing estimates of hearing loss in N.C. The 2010 population counts reflect the July 1, 2010 estimate released on February 23, 2012. The 2030 population counts reflect the July 1, 2030 estimate released on February 23, 2012.
While all states participate in the FSCPPE and produce their own population estimates,the estimates are released at different times. The 2010 census data by age group (see U.S. Census Bureau,) was used to develop hearing loss estimates for surrounding states. Because each state updates its census data at different times, the 2010 Census data allows a more consistent state to state estimate.The Census Bureau data represents the population count as of April 1, 2010.
Additional information and explanation on how the NHIS and population data sets were used are described in more detail below. The reader may find it helpful to begin with the explanation of the charts of estimated hearing loss in North Carolina by county because the state totals from those charts are shown on the graphs.
A key assumption in constructing the following charts and graphs is that distribution of hearing loss among age groups in North Carolina mirrors that of the NHIS findings.
This graph shows the 2010 N.C. population totals and estimated prevalence of hearing loss by age group (ages 18-64, 65-74, and 74 and older). The data in this graph shows the state totals found in 2010 Estimated Hearing Loss Population in North Carolina by County: Age 18 and Older chart.
This graph shows the projected population totals of adults in N.C. in 2030 who will have hearing loss by age group (ages 18-64, 65-74, and 75 and older). The data in this graph shows the state totals found in 2030 Estimated Hearing Loss Population in North Carolina by County: Age 18 and Older.
This graph compares statewide totals found in 2010 Estimated Hearing Loss Population in North Carolina by County: Age 18 and Older to statewide totals found in 2030 Estimated Hearing Loss Population in North Carolina by County: Age 18 and Older.
This graph compares the population totals and prevalence of hearing loss for N.C. and four neighboring states in 2010. The 2010 census data for North Carolina, Virginia, Tennessee, South Carolina, and Georgia was used as the population base against which hearing loss estimates were calculated. The estimate was prepared by:
Note: There is a slight difference in the calculated number of adults with hearing loss in N.C. using this approach. The two major reasons for this difference are:
This chart shows the population as of July 1, 2010 (February 23, 2012 release) and estimated prevalence of hearing loss by age group (ages 18-64, 65-74, and 75 and older)in 2010 in N.C. The data in the chart forms the basis for the 2010 graphs.
To determine hearing loss in each North Carolina county and statewide in 2010, DSDHH used the following methodology:
Example: As of July 1, 2010 Yancey County had 14,252 adults, age 18 and older. Of those adults, 10,565 were between ages 18 and 64. The 2010 NHIS estimates that 11.87% of adults in this age group have a hearing loss. The number of adults between ages 18 and 64 with a hearing loss in Yancey County is estimated to be 1,254 (10,565 x 11.87%). The same methodology was applied to each age group using the NHIS percentage for that age group. The estimated number with hearing loss by age group was summed to determine the county total. The total estimated number with hearing loss in Yancey County is 2,628, or 18.44% of the county’s adult population
This same methodology was applied to all 100 counties. The total of adults, ages 18 and older, with a hearing loss in all counties is estimated to be 1,182,610, or 16.2% of the state’s adult population.
The chart sorts the data from 2010 Estimated Hearing Loss Population in North Carolina by County: Age 18 and Older by each of the seven (7) DSDHH regional centers. The data shows the estimates of hearing loss by age group and the total number of adults with hearing loss by region. The hearing loss estimate for each regional center was calculated by totaling the number of adults with hearing loss across all age groups. Each region’s estimated hearing loss population was calculated as a percentage of the region’s total adult hearing loss population.
This chart shows the population as of July 1, 2030 (February 2012 release) and estimated prevalence of hearing loss by age group (ages 18-64, 65-74, and 75 and older) in 2030 in N.C. The data in the chart forms the basis for the 2030 graphs.
To determine hearing loss in each North Carolina county and statewide in 2030, DSDHH used the following methodology:
Example: As of July 1, 2030 an estimated 1,072,485 adults, age 18 and older, will be living in Wake County. Of those adults, 859,242 will be between ages 18 and 64. The average 2007-2010 NHIS estimates for adults with a hearing loss in the 18-64 age group is 11.31%. The number of adults between ages 18 and 64 with a hearing loss in Wake County is estimated to be 97,180 (859,242 x 11.31%). The same methodology was applied to each age group using the average 2007-2010 NHIS percentages for that age group. The estimated numbers by age groups were summed to determine the county total. The total estimated number with hearing loss in Wake County is 172,999, or 16.13% of the adult population in that county.
This same methodology was applied to all 100 counties. The total of adults, ages 18 and older, with a hearing loss in all counties in 2030 is estimated to be 1,669,518, or 17.36% of the state’s adult population.